
Highlights

Research Centers
- 3 Revolutions Future Mobility
- BicyclingPlus Research Collaborative
- China Center for Energy and Transportation
- Electric Vehicle Research Center
- Energy Futures
- European Transport and Energy Research Centre
- India ZEV Research Centre
- Mobility Science Automation and Inclusion Center
- National Center for Sustainable Transportation
- Policy Institute for Energy, Environment, and the Economy
- Sustainable Transportation Energy Pathways (STEPS+) Program
- Sustainable Freight
- Transit Research Center
- VMT, Land Use, and Equity Lab
Affiliated Research Centers & Initiatives
- Active Transportation Research Center
- Consumer Energy Interfaces (cEnergi) Lab
- Energy and Efficiency Institute
- Pacific Southwest Region University Transportation Center
- Road Ecology Center
- UC Institute of Transportation Studies
- University of California Pavement Research Center
- World Conference on Transport Research Society
Featured Publications
View All- If You Build It, Will They Notice? Public Charging Density, Charging Infrastructure Awareness, and Consideration to Purchase an Electric Vehicle
- Future Electric Vehicle Production Plans in the United States and Europe – Will It Be Enough?
- Impacts of Connected and Automated Vehicles on Travel Demand and Emissions in California
- To Adopt Rooftop Solar or Not Along With Electric Vehicles? Exploring the Factors Influencing Co-adoption Decisions Among Electric Vehicle Owners in California
- Truck Transportation in California: Disaggregating Public Health Costs From Criteria Pollutants
- A Systematic Review of Life Cycle Greenhouse Gas Intensity Values for Hydrogen Production Pathways
- Study on Leaching Characteristics and Biotoxicity of Porous Asphalt With Biochar Fillers
- Reducing Motor Vehicle GHG Emissions via Land-Use and Transport Integration: Realistic Expectations and Essential Strategies
- Nuclear Power Generation Phase-Outs Redistribute US Air Quality and Climate-Related Mortality Risk
- Assessing the Economic Impact of Speed Limit Changes on Safety and Mobility in California
- Spatial-Temporal Self-Attention Transformer Networks for Battery State of Charge Estimation
- Addressing Vulnerabilities in the Supply Chain of Critical Minerals
Check Out Our ITS-Davis Newsletter!
View AllIn The News
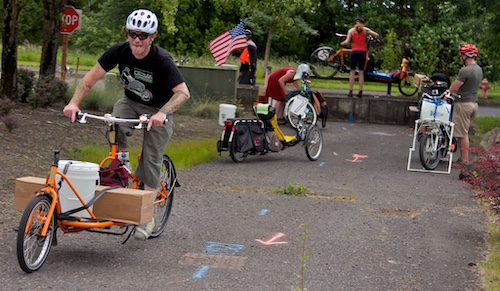
The Institute of Transportation Studies at the University of California Davis has highlighted a potentially significant but overlooked use of bicycles and other forms of micromobility.
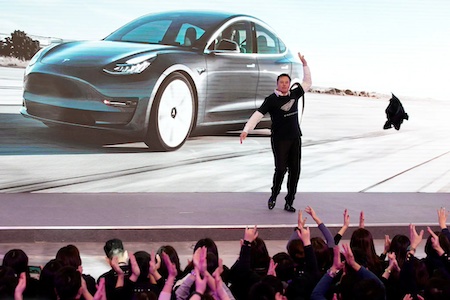
Tesla and China built a symbiotic relationship, with credits, workers and parts that made Mr. Musk ultrarich. Now, his reliance on the country may give Beijing leverage. Yunshi Wang, director of the China Center for Energy and Transportation at the University of California, Davis, weighs in.
“Now, automakers have a few more years to finalize their full electric portfolio,” says Gil Tal, who directs the Plug-In Hybrid and Electric Vehicle Research Center at UC Davis.
Thank you for your interest in the UC Davis Institute of Transportation Studies. Subscribe today to keep up with the latest ITS news and happenings.